
Measuring The
Invisible
UNCOVER THE HIDDEN ISSUES HOLDING BACK YOUR TEAM… AND YOUR SUCCESS
Inclusion is like health: just as we tend to notice when we are sick more than when we are healthy, we are more likely to notice when we are excluded than when we are included.
And just as healthy people are unfamiliar with the symptoms of a disease and how to cure it, those who enjoy high inclusion —often the leaders — are least likely to see exclusion or understand how to fix it. This is why leadership alignment can be so difficult, and why measuring inclusion is essential: it makes the invisible visible.
But asking traditional questions such as “How included do you feel?” is as unhelpful as a doctor trying to diagnose a disease by only asking a patient “How sick do you feel?”
Real insight comes from asking about specific experiences that lead to feelings of inclusion, just as a doctor asks about specific symptoms to understand your health condition.
WHY INCLUSION IS INVISIBLE
We ask employees to share concrete workplace experiences that interfered with their ability to do their jobs. These experiences are then organized into Categories of Inclusion, which represent the full range of factors that shape satisfaction, inclusion, and belonging.
We also ask about the source of each experience—whether it came from a policy, a manager action, a process, or an external interaction. This mirrors how doctors identify the causes of symptoms.
HOW WE MEASURE THE INVISIBLE
The combination of qualitative experiences and quantitative categorization pinpoints exactly what’s happening, why it’s happening, who is impacted, and what to fix.
TURNING DATA INTO INSIGHTS > MAKING THE INVISIBILE VISIBLE
Aleria’s platform provides a simple, intuitive, fully anonymous interface where employees can:
• Share specific experiences confidentially.
• Select the Categories and Sources that best describe each experience.
• Mark experiences as “OK to share” to help leaders see what they normally cannot.
Employees can also anonymously share demographic and identity information—entirely, optional and customizable.
When linked to experience data, this reveals whether certain groups face different workplace realities. Confidentiality is non‑negotiable. Every insight is aggregated and anonymized to ensure trust and safety
OUR PLATFORM
Once data is collected, our data scientists apply advanced analytics to reveal:
• What is happening across the organization.
• Why is it happening.
• Who is most affected.
• What is the cost in lost productivity and attrition.
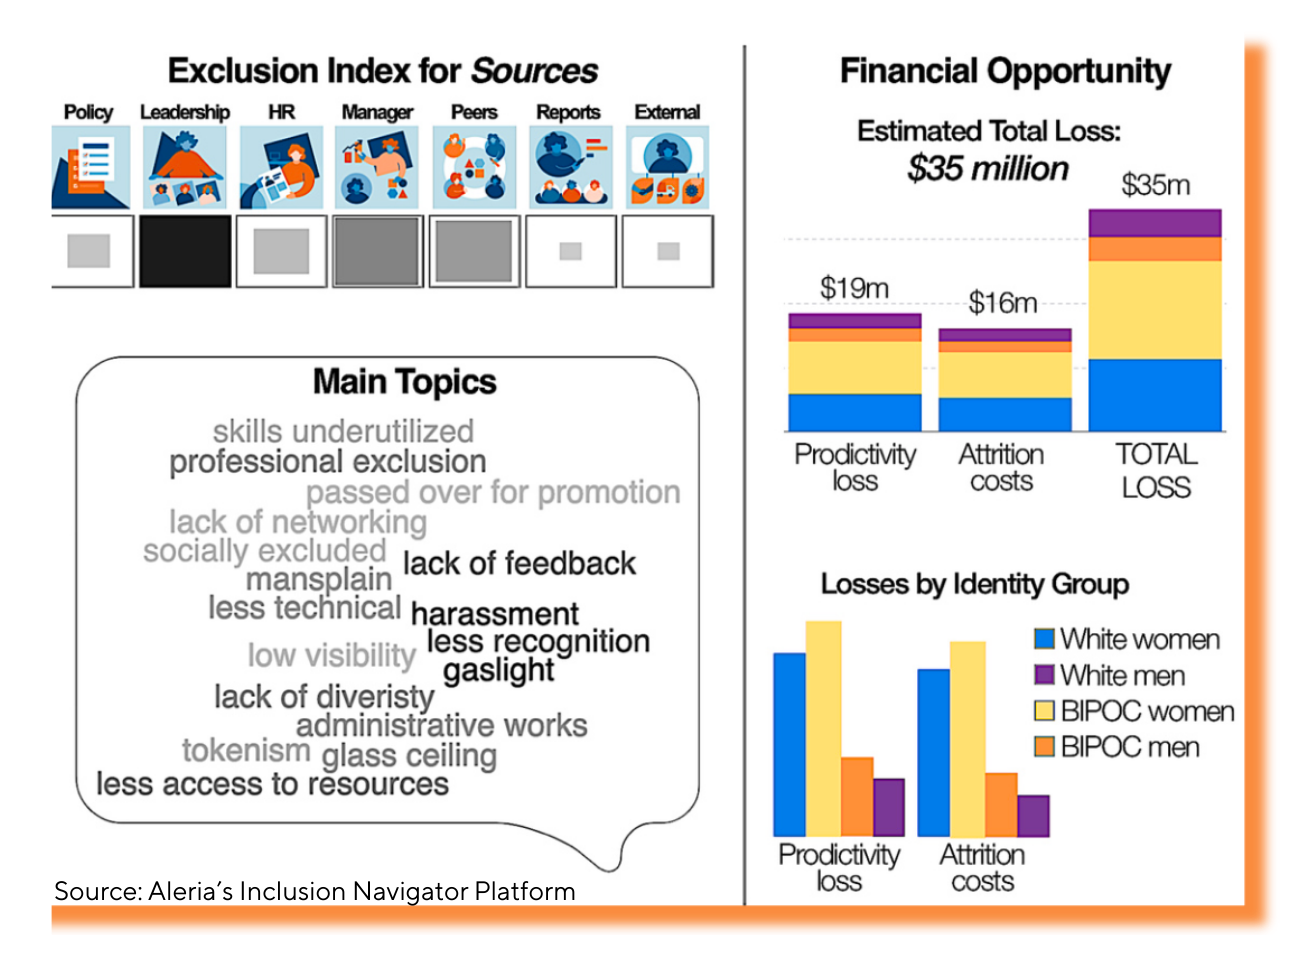
These insights power tools like the Inclusion Impact Calculator, which estimates the financial cost of low inclusion, and the Inclusion Navigator, a dashboard where leaders can explore patterns, drill into details, and identify the highest‑value actions.
Privacy is central
All data is untraceable, and organizations never receive raw responses—only insights that cannot be linked to individuals.
START YOUR JOURNEY
Organizations that begin their Journey to Inclusive Meritocracy quickly understand why Measuring Inclusion becomes a core part of their long‑term strategy. It uncovers hidden barriers, strengthens leadership alignment, and accelerates progress toward becoming a more inclusive, more successful, and more diverse organization.